Beyond the Box Score: Introducing AGI
The metric nobody asked for (but the one we all need)
Introduction
The beginning of basketball season is always an exciting time for me. I have watched college and NBA basketball for as long as I can remember. As a kid, I would rip through the daily newspaper until I reached the sports page, just to look at articles, schedules, stats, and standings. It didn't matter if it was a professional league or the local high schools. With age came an interest in gauging the success (or potential success) of different players and teams.
As time has gone on, advanced analytics have evolved into several different forms. Player efficiency, raw on/off plus-minus, and adjusted plus-minus all paved the way for sexier models like BPM (Box Plus/Minus) and VORP. Those, in turn, broke ground for LEBRON, RAPTOR, and EPV. While these models have, over time, become less primitive and highlight efficiency rather than pure output, they still under-credit defense.
One gaping hole in all of these metrics is that they fail to include context. If a player scores 40 points, the box score and the metrics built on it will reward that total. However, they fail to account for potential lapses on defense, 10-for-31 shooting, 8 turnovers, etc. Another player may have scored less, but their impact on the game could be much higher.
Aggregated Game Impact (AGI) addresses many of these problems.
What is AGI?
AGI was in the works for many years before any code was written. At first, it was destined to be a pure, defense-first, hustle-based metric. It would highlight players like Paul George, Jrue Holiday, and Amen Thompson. Over time, it morphed to include some offense, then efficiency, then a true aggregation of many of the other metrics that came before it.
AGI takes a player's numbers from a single game and computes an overall score composed of several different components.
Offense: How well did a player score, including shots taken under a defender's contest?
Defense: Beyond steals and blocks, what else did the player do on the defensive side of the ball to affect the outcome of the game?
Rebounding: Was the player in position to rebound? Were they able to convert on those opportunities?
Playmaking: Assists are a great number, but they can be bloated. Can players be graded on how well they set their teammates up, even if it doesn't result in a tick on their scoresheet?
Connective: The meat and potatoes of basketball. Is a player making screens, boxing out, passing, or doing the things that won't necessarily earn them a max contract?
Clutch: If a player performs in the final minutes of a close game, they receive a bonus.
Efficiency: Is an efficient 20 points better than a shot-chucking 27?
Costs: Turnovers and missed shots actively make it harder for your team to win. How much did a player try to give the game away?
After scoring, each game is awarded a "Game MVP". One thing to note is that the "Game MVP" can come from the losing team. Because AGI is not "points added", predictive, or position-dependent, a losing player may have had the largest impact on the game regardless of the outcome. For example, Domantas Sabonis regularly has a high AGI despite his team losing many games.
The data
The data powering AGI comes from multiple different sources in multiple different layers: Core, Enhanced, and Context.
The Core layer includes basic box score details. It covers everything from points to shot attempts to fouls. The Enhanced layer is powered by NBA hustle and tracking data. This encompasses stats like deflections, shot contests, charges, passing, and more. The Context layer only powers clutch scenarios as a v0, but there are already plans to expand that.
Overall, the data that has already been calculated includes more than 10,000 NBA games since the 2018-19 season. More than 99% of all games are supported by the Enhanced layer.
The metric is heuristically determined, using static weights for almost every stat involved in the computation. The weights have been through several rounds of testing to determine which areas offer the most impact all around. Initially, the metric started as a priority ranking, but was quickly rebalanced after offense dominated nearly every player's score.
Problems addressed by AGI
Each metric prior to AGI had its own blind spots and areas that were missed, intentionally or not. These are not often understood by laypeople, but shouldn't require a degree in statistics to fully grasp. AGI helps alleviate some of those areas.
Problem 1: Box Score Blindness
The defensive box score mostly counts blocks and steals. These numbers rarely tell the entire story, even for defensive specimens like Victor Wembanyama. AGI addresses this issue by including contests, deflections, rim protection, loose balls, box-outs, and screens.
Problem 2: Hastily Rewarding Scoring Volume
Just because a player scored over 30 points doesn't automatically mean they were the most impactful player in the game. If a player is inefficient on the night, that increases their costs and ultimately hurts their overall AGI. At the same time, a miss shouldn't cost every player the same amount. A 10-for-15 night should not count the same as a 0-for-5 night.
Problem 3: Undercounted Playmaking
Playmaking is much more than pure assist numbers. Is a player setting their teammates up for success? Potential, secondary, and free-throw assists tell a much more complete story.
Problem 4: Clutch Matters
When the game comes down to the wire in the NBA, a team tends to put the ball in their best player's hands. AGI gives a bonus for production in the final five minutes of games within five points.
Problem 5: Black-Box Aggregation
AGI is an attempt to provide users with a peek behind the curtain. There's no confusion as to what pieces contribute to a player's score.
Example
Cooper Flagg has already been one of the league's best players. In only his second season, he is playing at an All-NBA level. His play is one of the main contributing factors that have put the Mavericks in a better situation than most fully anticipated.
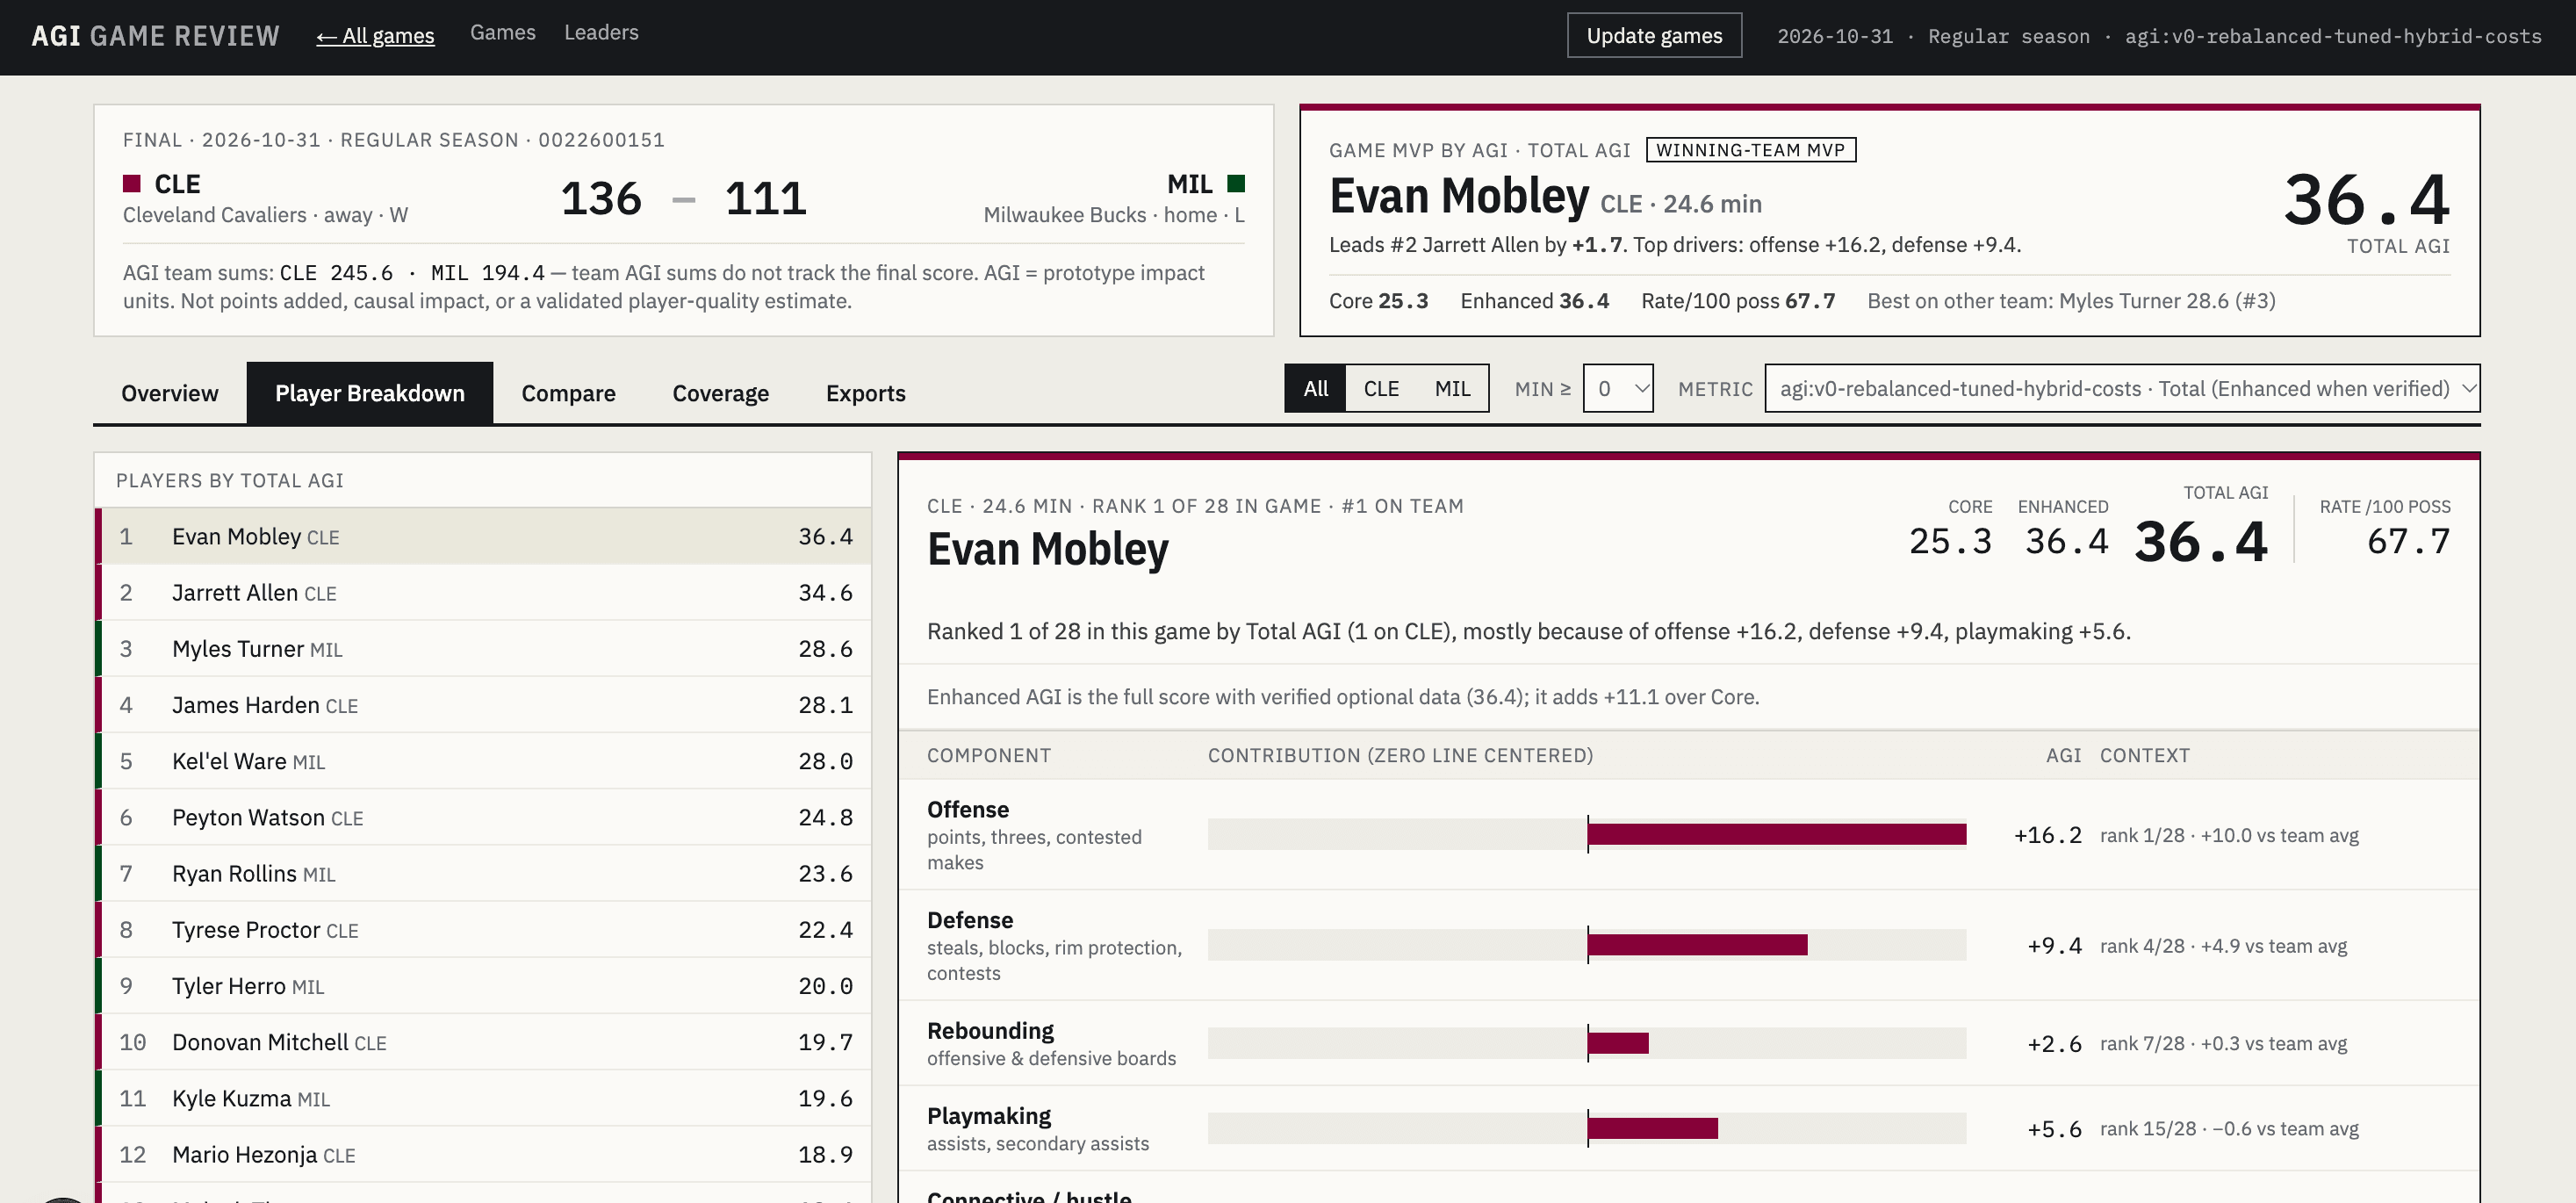
On October 30, 2026, Dallas beat the Houston Rockets 116-111, led by Flagg's 33 points. The AGI dashboard shows Flagg and his teammate Kyrie Irving contributing the most to Dallas's victory.
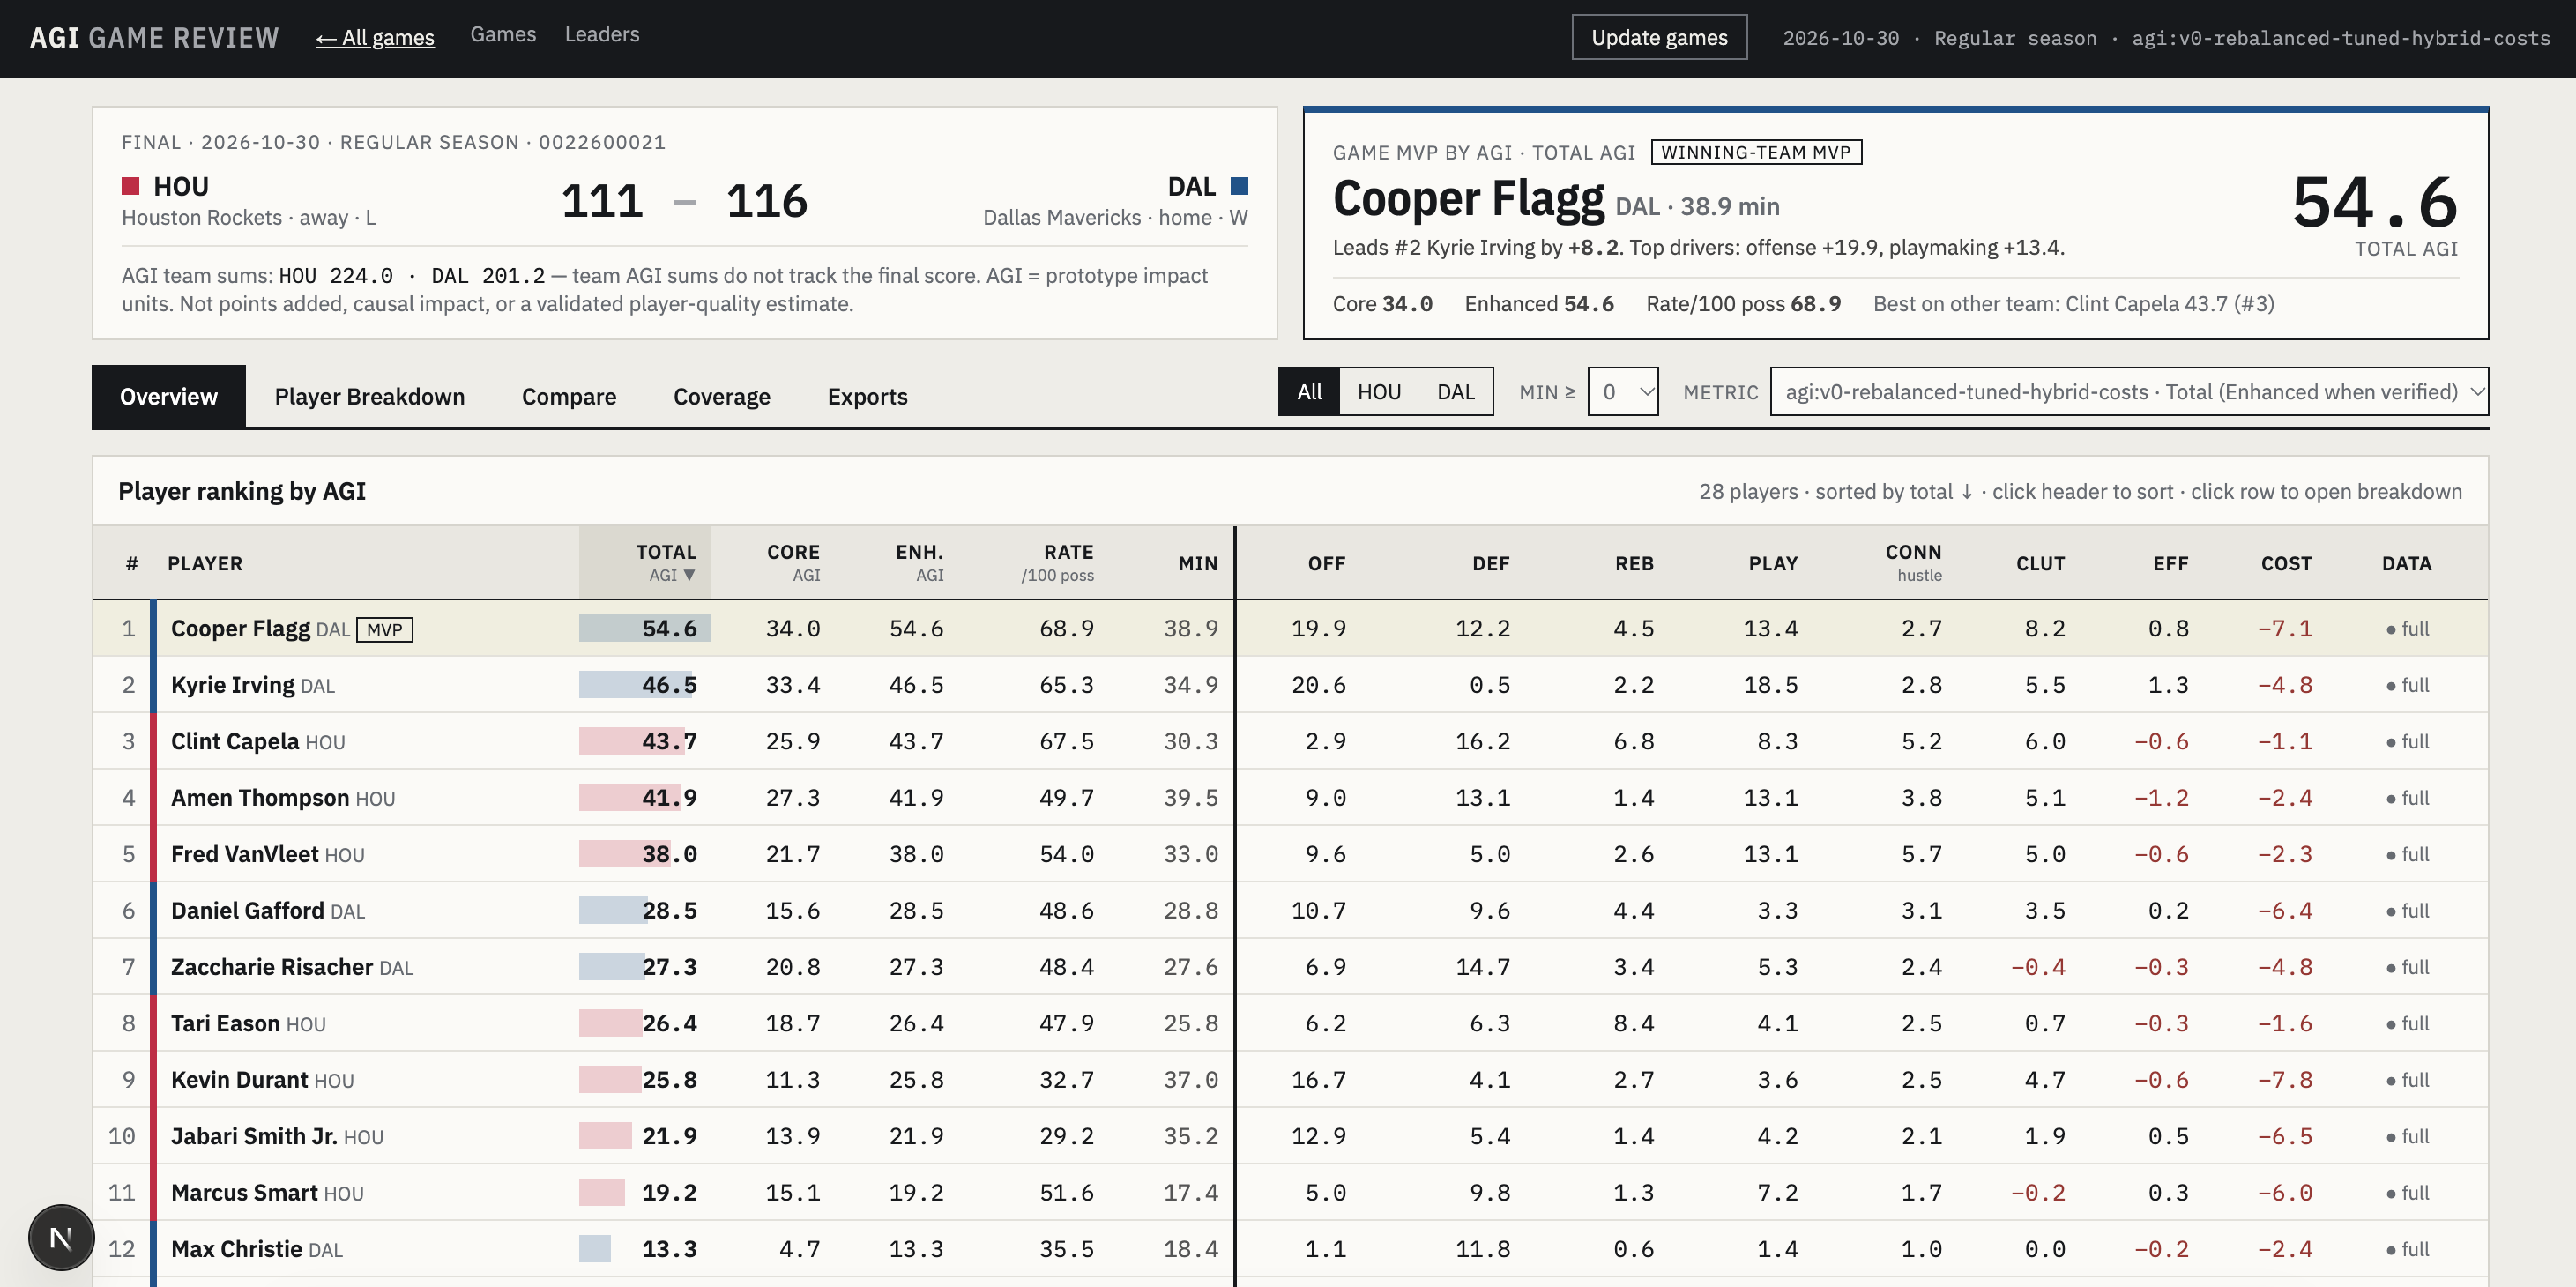
By toggling between players, a user can get more detailed information on the components that led to that player's performance.
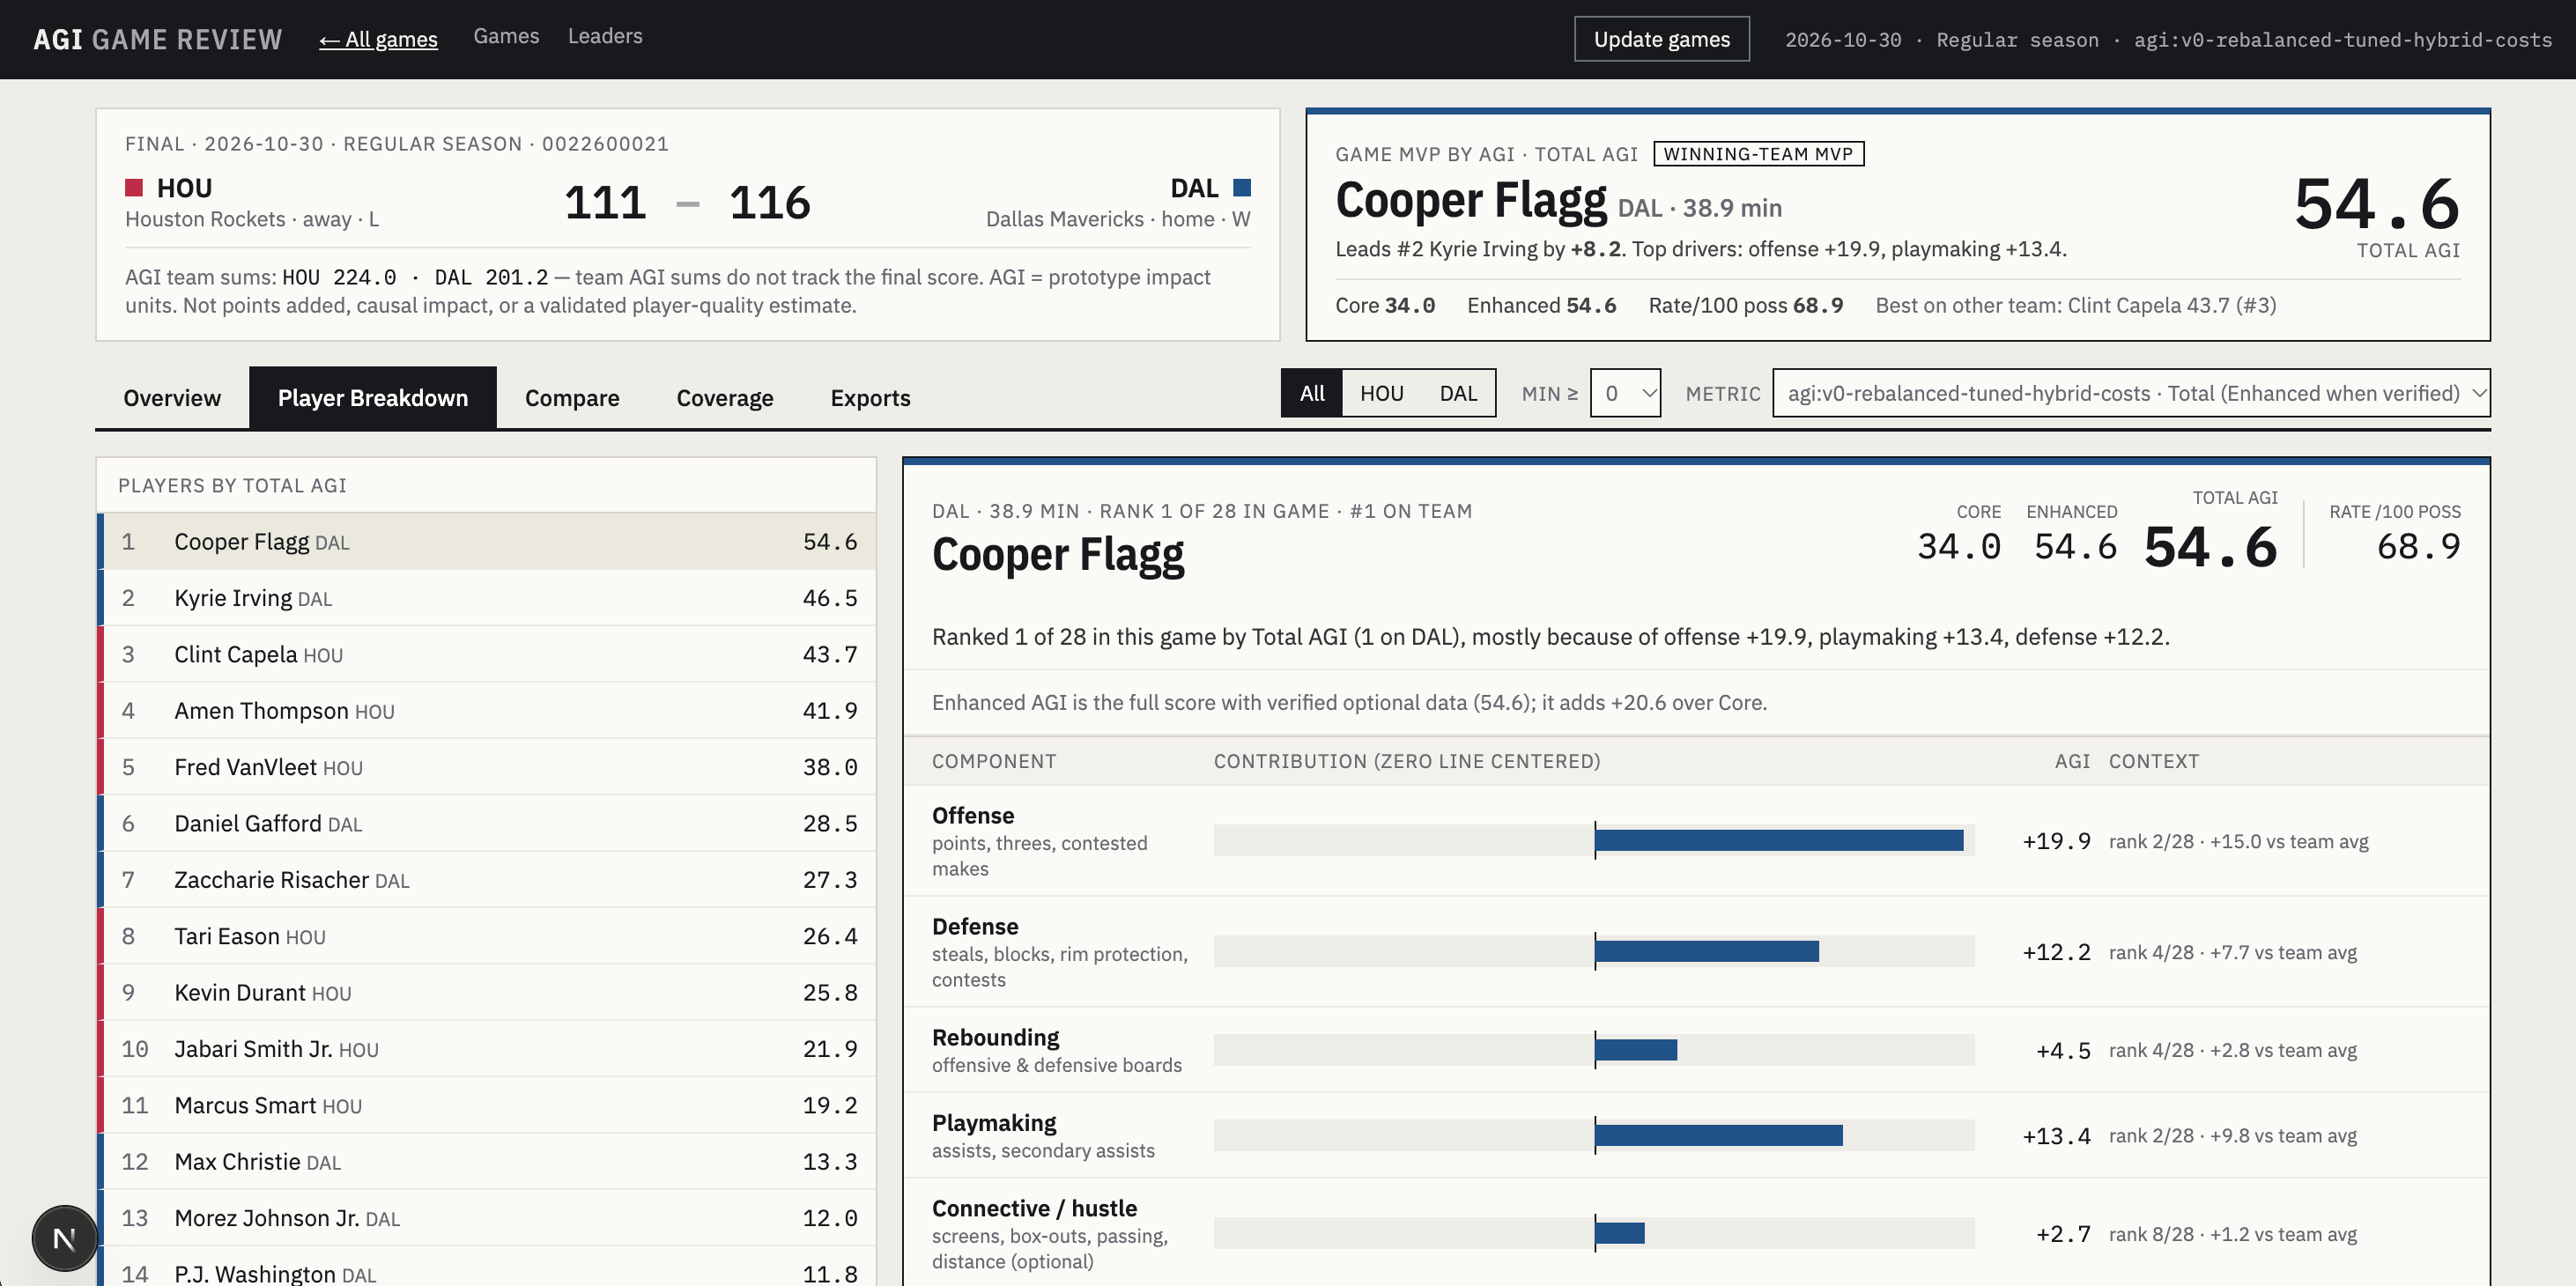
Here, Flagg's 33 points on 68% shooting from the field with 10 free throws attempted contributed to him adding 19.9 to his offense component.
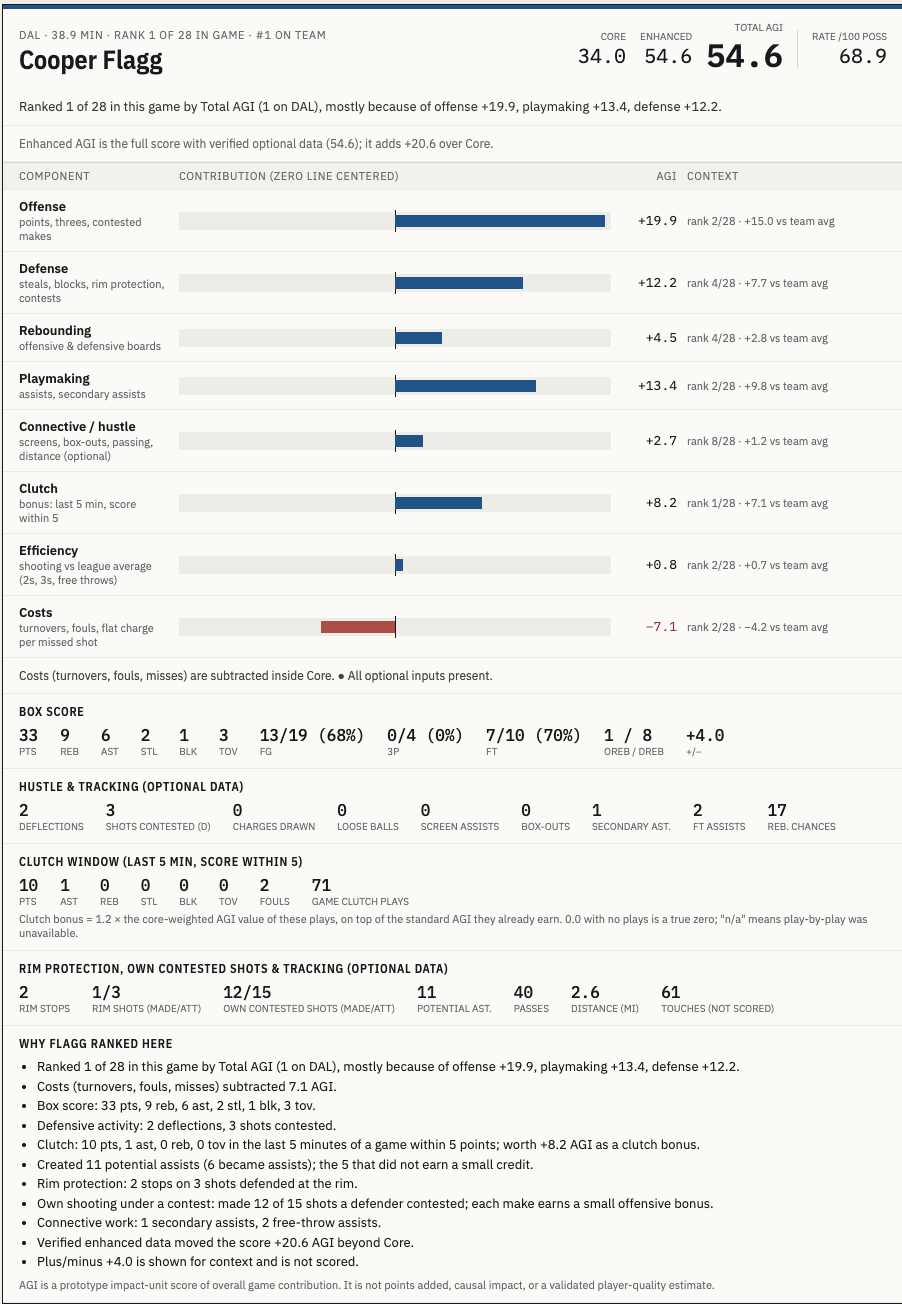
The most impressive is Flagg's +8.2 clutch AGI, indicating his contribution late in the game. A look at the Clutch section tells the complete story. Flagg scored 10 points and tallied an assist in the clutch minutes of Dallas's win over the Rockets.
This is just one instance of using AGI for analyzing a player's performance. AGI can also be used to compare starters and bench players, evaluate trade targets, measure hustle, and spot empty-calorie stats.
Looking forward
AGI will be used at The Aggregated specifically to take a look at the Utah Jazz, comparing their best players, spotlighting who had a good week, and naming each game's MVP. However, AGI has been created to perform analysis across the league.
Weekly leaders will be posted in a new article every Sunday with one interesting